EXECUTIVE SUMMARY

To have a better understanding of each post and its sentiment, a topic was defined for each post and it is evident that some topics are likely to be more positive, while some are not. Since these topics are overlapping on words like "elderly" and "crow", those unique words will explain more for the topics. The average Pos-Neg Ratio of all posts is 1.64, while the ratio of Topic 4 (more about accusation) is only 1.13, compared to 3.94 for Topic 3 (more about improvement). Therefore, the topic is indeed a important feature to determine the sentiment of a post, which is proved in the following analysis.

Summary Table of Topic (Average Pos-Neg Ratio: 1.64)
Topic 0
Keywords: senator
Pos-Neg Ratio: 2.05
Topic 1
Keywords: short, das
Pos-Neg Ratio: 1.61
Topic 2
Keywords: integrate, conspiracy
Pos-Neg Ratio: 1.46
Topic 3
Keywords: improvement
Pos-Neg Ratio: 3.94
Topic 4
Keywords: officer, hillary, accusation
Pos-Neg Ratio: 1.13
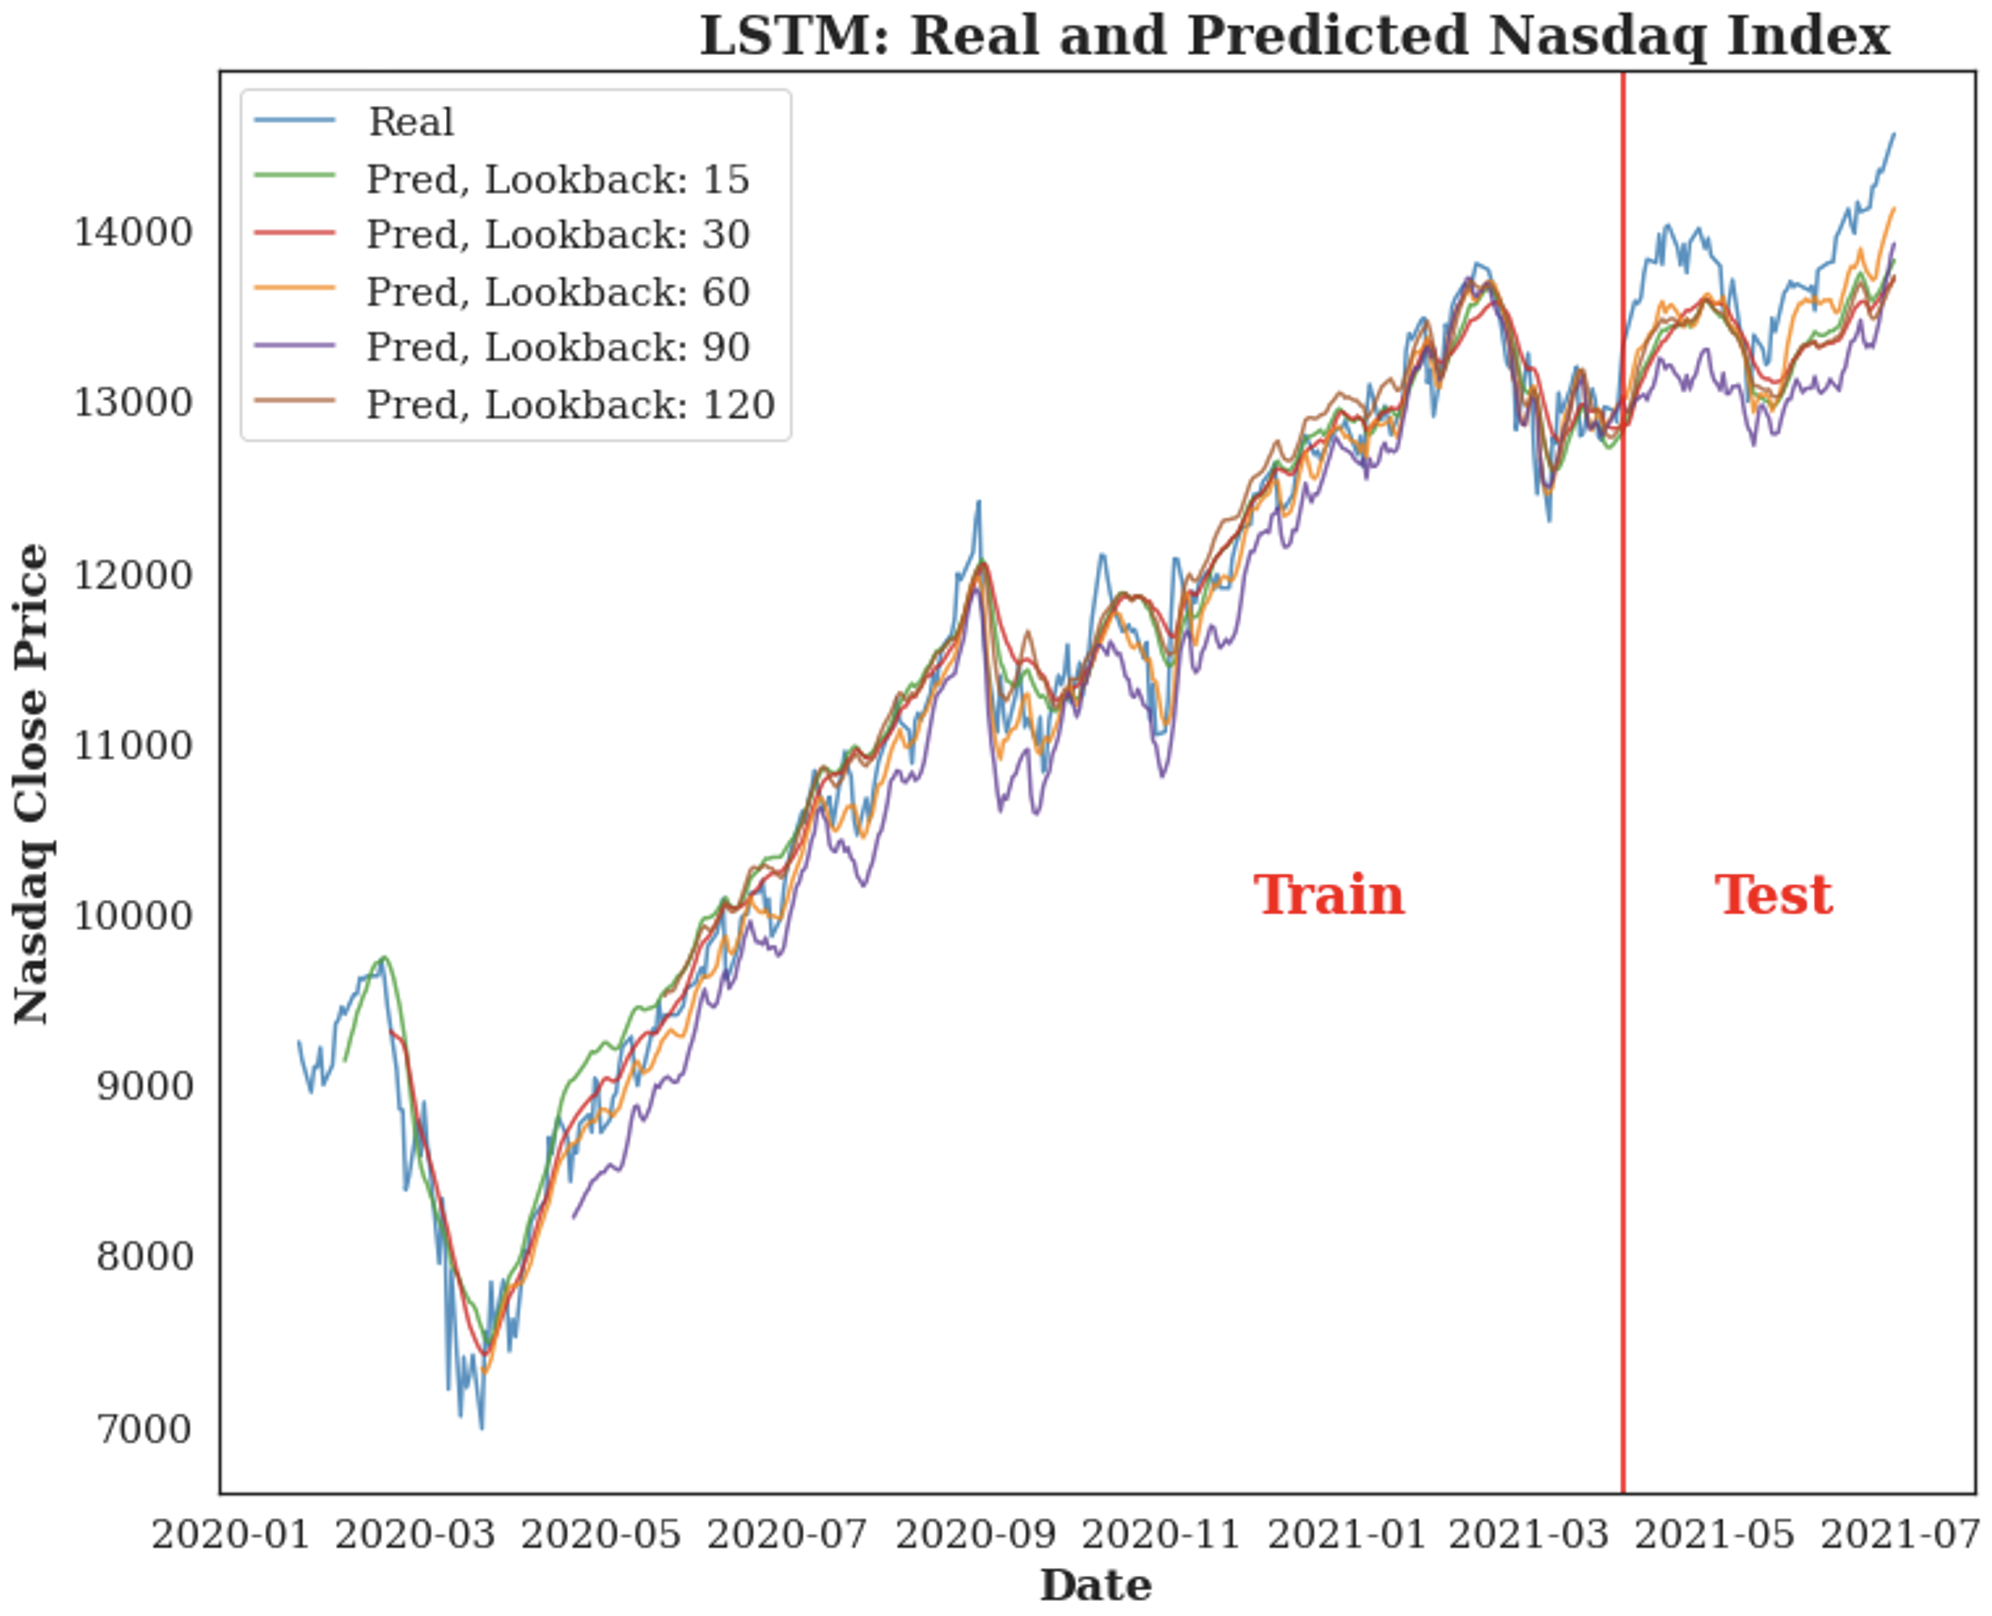
Apart from the topic, whether the post is racial equality and government related or not is also the determinants of posts' sentiment. Since political factor is always an essential feature of stock market, these subreddit posts may have an impact on the stock prices. According to the time series plot of Nasdaq Index, the predictions is pretty close to the real close prices. And the best model uses the last 60 days' historical data to make a prediction of the next day price.
Summary Table of Topic (Average Pos-Neg Ratio: 1.64)
Topic 0
Keywords: senator
Pos-Neg Ratio: 2.05
Topic 1
Keywords: short, das
Pos-Neg Ratio: 1.61
Topic 2
Keywords: integrate, conspiracy
Pos-Neg Ratio: 1.46
Topic 3
Keywords: improvement
Pos-Neg Ratio: 3.94
Topic 4
Keywords: officer, hillary, accusation
Pos-Neg Ratio: 1.13

Topic Modeling - LDA


Different Topics, Different Keywords, Different Sentiments

LDA, one of the most famous topic modeling methods was utilized here to define a topic for each post. It can be recognized that some specific topics tend to be more positive, while some are not. Some keywords appear in more than one topic, so those unique words will explain more for the topics. The average Pos-Neg Ratio of all posts is 1.64, while the ratio of Topic 4 (more about accusation) is only 1.13, compared to 3.94 for Topic 3 (more about improvement)

Normally Distributed on Each Dimension

After defining topics for all the posts, it is necessary to know about the distribution of our topic to see if the model works well. Therefore, t-SNE, a tool to visualize high-dimensional data, was applied onto the results of TF-IDF to reduce the data to 2 dimensions, and these points were colored based on their topics. In agreement with the plot, each topic is normally distributed on these two dimensions, elucidating the successful seperation of LDA model.

Sentiment Prediction
Based on the Features of Post

Complex Model Does Not Make a Big Difference

To find the relationship between the post sentiment and the post other features, three different types of model were constructed, and for each type of model, three different hyperparameter sets were applied.

Before constructing these models, the data were subset in the first half of 2020, since we want to find the influence of the pandemic, and only some important features were kept, including author_flair_text, score, topic, covid, etc. Also, training set, validation set and test set were sampled from the whole data set based on the following proportion (0.8, 0.18, 0.02).

According to the evaluation metrics, those complex models did not make a big difference, but they did require much more time in training, hence, the simpler model would be a better choice here.

Besides, in line with the AUC score, which is nearly close to 0.5, these models actually did not make a really good prediction on the test set, which is acceptable since the sentiment of a post is usually directly related with the text itself, instead of the topic or post score.

Hyperparameter Tuning
Random Forest
numTrees maxDepth Accuracy F1-Score Precision Recall AUC
50 5 0.6502 0.5567 0.6416 0.6502 0.5320
100 5 0.6503 0.5563 0.6425 0.6503 0.5318
100 10 0.6507 0.5564 0.6444 0.6507 0.5321
Gradient-Boosted Trees
maxIter maxDepth Accuracy F1-Score Precision Recall AUC
10 5 0.6505 0.5563 0.6434 0.6505 0.5319
20 5 0.6509 0.5611 0.6404 0.6509 0.5344
20 10 0.6511 0.5702 0.6341 0.6511 0.5391
Logistic Regression
maxIter threshold Accuracy F1-Score Precision Recall AUC
100 0.5 0.6504 0.5589 0.6400 0.6504 0.5331
200 0.5 0.6504 0.5589 0.6400 0.6504 0.5331
200 0.45 0.6496 0.5668 0.6308 0.6496 0.5366

Racial Equality, Goverment and Topic

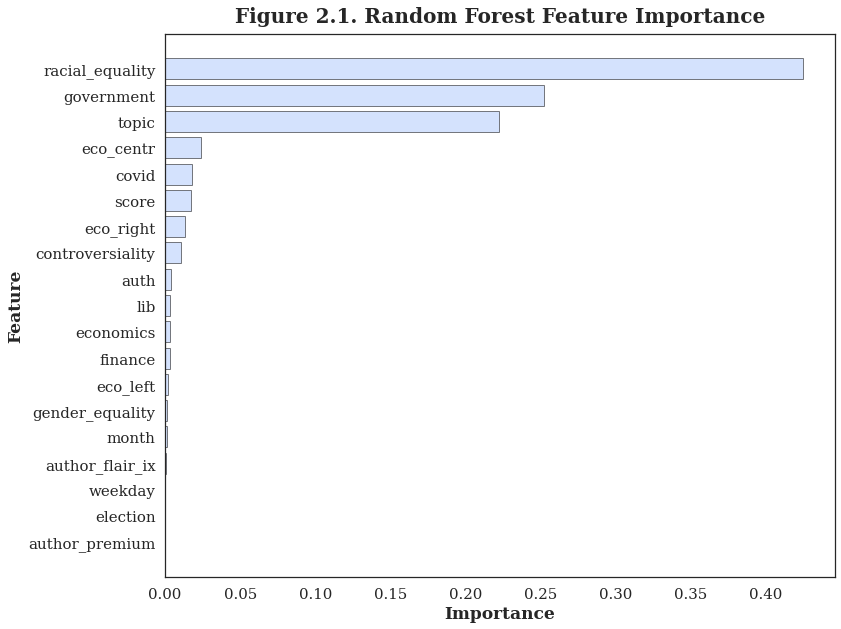
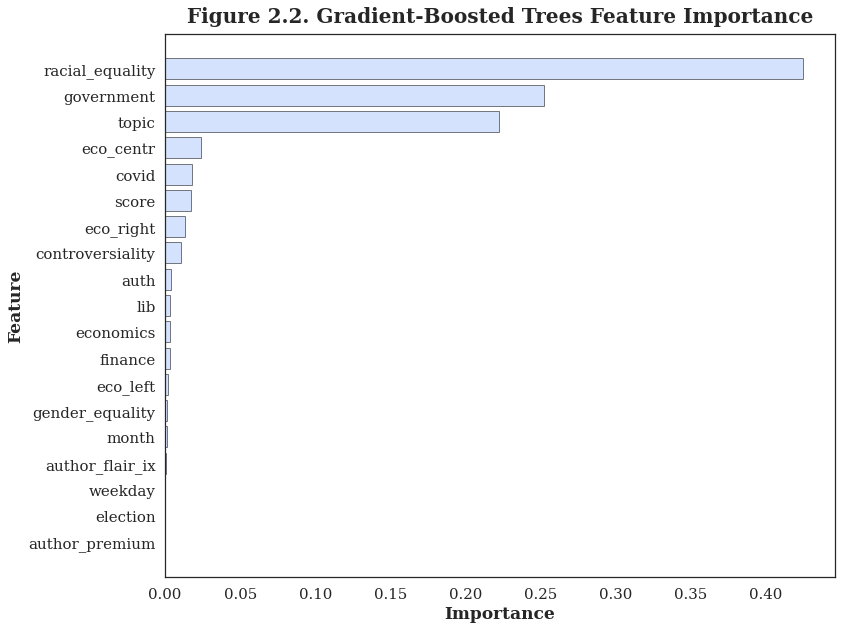
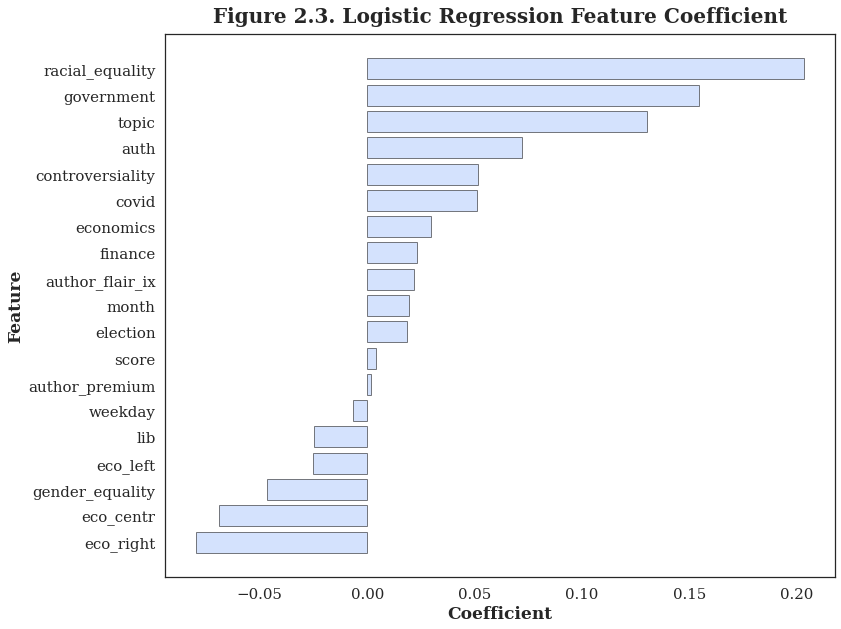
In order to figure out the determinants of the sentiment for a post, the bar plots of feature importance were made for all these three simplest models, revealing that whether the post is racial equality and government related or not and its topic are the most important three determinants of a post's sentiment.

Hyperparameter Tuning
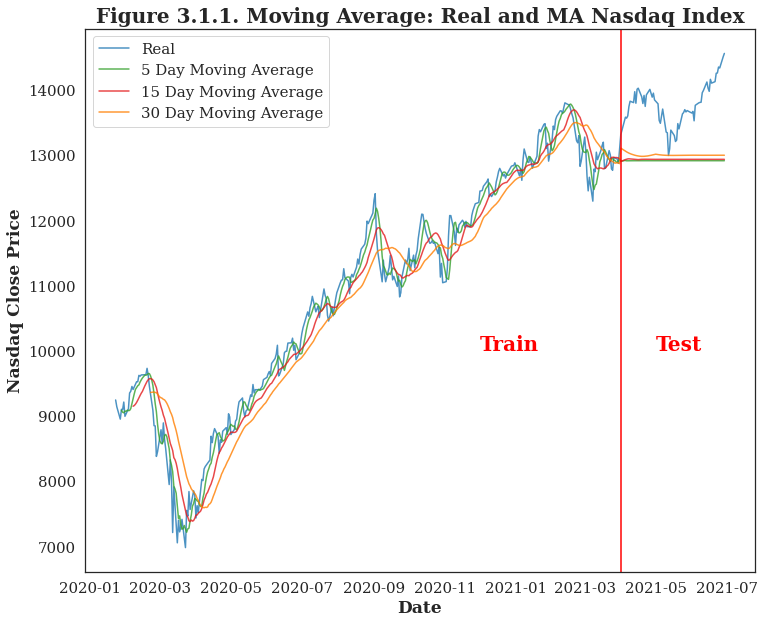
Moving Average (Baseline Model)
Lookback Training R-Squared Training RMSE Test RMSE Test MAPE
5 0.9849 216.0944 921.2071 0.0623
15 0.9636 335.6070 901.6648 0.0608
30 0.9262 480.6264 839.9877 0.0557
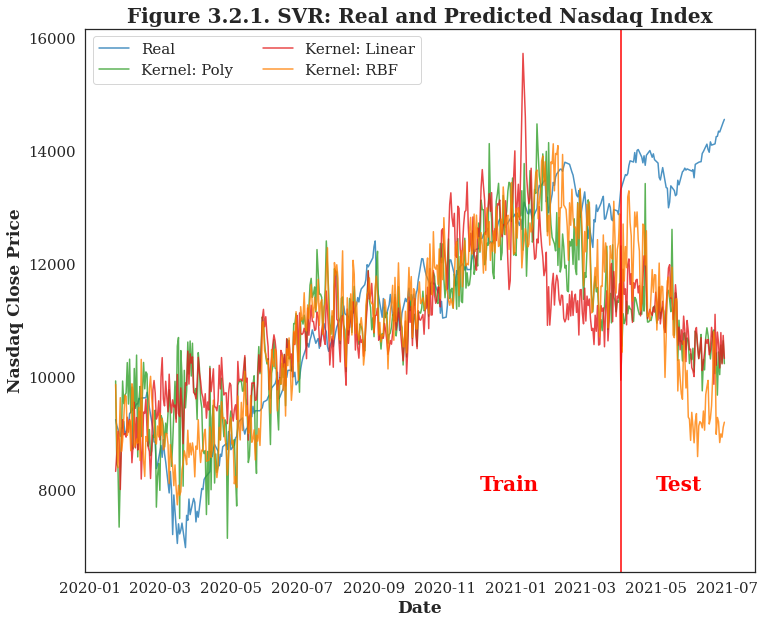
Support Vector Regression
Kernel Training R-Squared Training RMSE Test RMSE Test MAPE
poly 0.6860 985.9986 2969.8434 0.2078
linear 0.5547 1174.2439 2869.1457 0.2008
rbf 0.8528 675.0404 3389.8888 0.2218
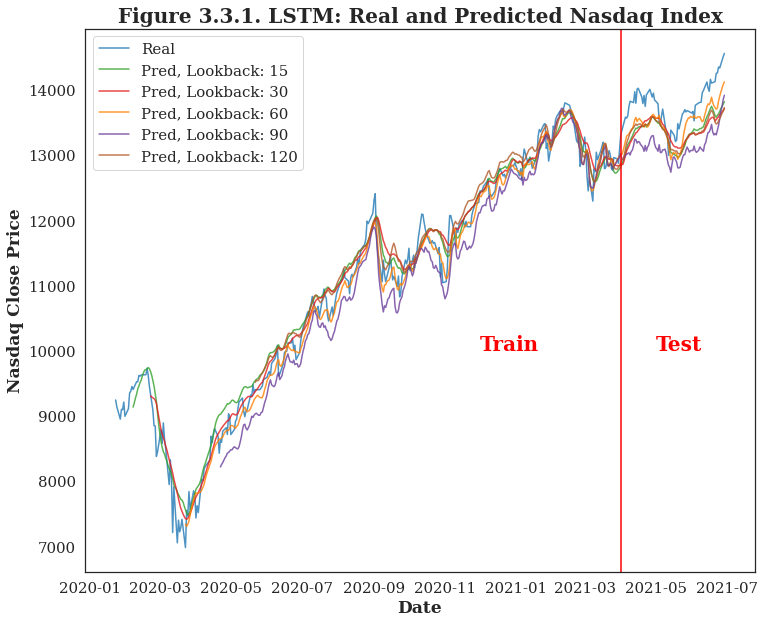
Long Short Term Model
Lookback Training R-Squared Training RMSE Test RMSE Test MAPE
15 0.9792 253.6997 453.3420 0.0305
30 0.9804 247.7742 476.2668 0.0311
60 0.9881 176.6279 344.5321 0.0227
90 0.9485 308.5264 667.7971 0.0467
120 0.9606 230.3190 462.4384 0.0306

Stock Price Prediction
Based on the Daily Sentiment of Subreddit

LSTM Can Help to Defeat the Average

Stock Market fluctuates all the time because of tons of factors, making it more difficult to predict than other data. In this project, SVR and LSTM were chosen to construct models, trying to predict the Nasdaq Index, based on the daily sentiment of subreddit.

Feature engineering is always the first step to take when constructing predictive models, and daily number of posts, pos-neg ratio, post average score, negative post average score, positive post average score were calculated from the big reddit dataset. Besides, COVID daily new cases and new deaths were also included in the features. Since stock price is timeseries data, it cannot be random splitted into training and testing set. Consequently, the data were splitted by the date 04/01/2021.

In LSTM, a lookback period was predifined so that the model can not only learn about the information on one day, but also learn more patterns about the past trend. In accordance with the evaluation metrics, LSTM performs better than the Moving Average, especially with 60 days' lookback, while SVR actually has a rather poor performance on the test set.

download

LSTM with 60 Days' Lag

LSTM now can be proved to be able to defeat the moving average, and among all these choices of lookback days, 60 days' lag can provide enough information for the model to learn about the patterns and trends. When it is moving forward and getting farther away from the last training date, the predicted price will also get farther away from the true price

Summary

  1. Some specific topics tend to be more positive, while some are not. The average Pos-Neg Ratio of all posts is 1.64, while the ratio of Topic 3 (more about bankrupt and persecution) is only 1.13, compared to 3.94 for Topic 2 (more about integrate and conspiracy).
  2. The sentiment of a post is usually directly related with the text itself, instead of the topic or post score.
  3. Whether the post is racial equality and government related or not and its topic are the most important three determinants of a post's sentiment.
  4. LSTM performs can defeat the Moving Average, especially with 60 days' lookback.

Resources

What's next?

Next section is Conclusions, we will summarize all the findings we have so far.