Chicago, City of Wonder and Crime

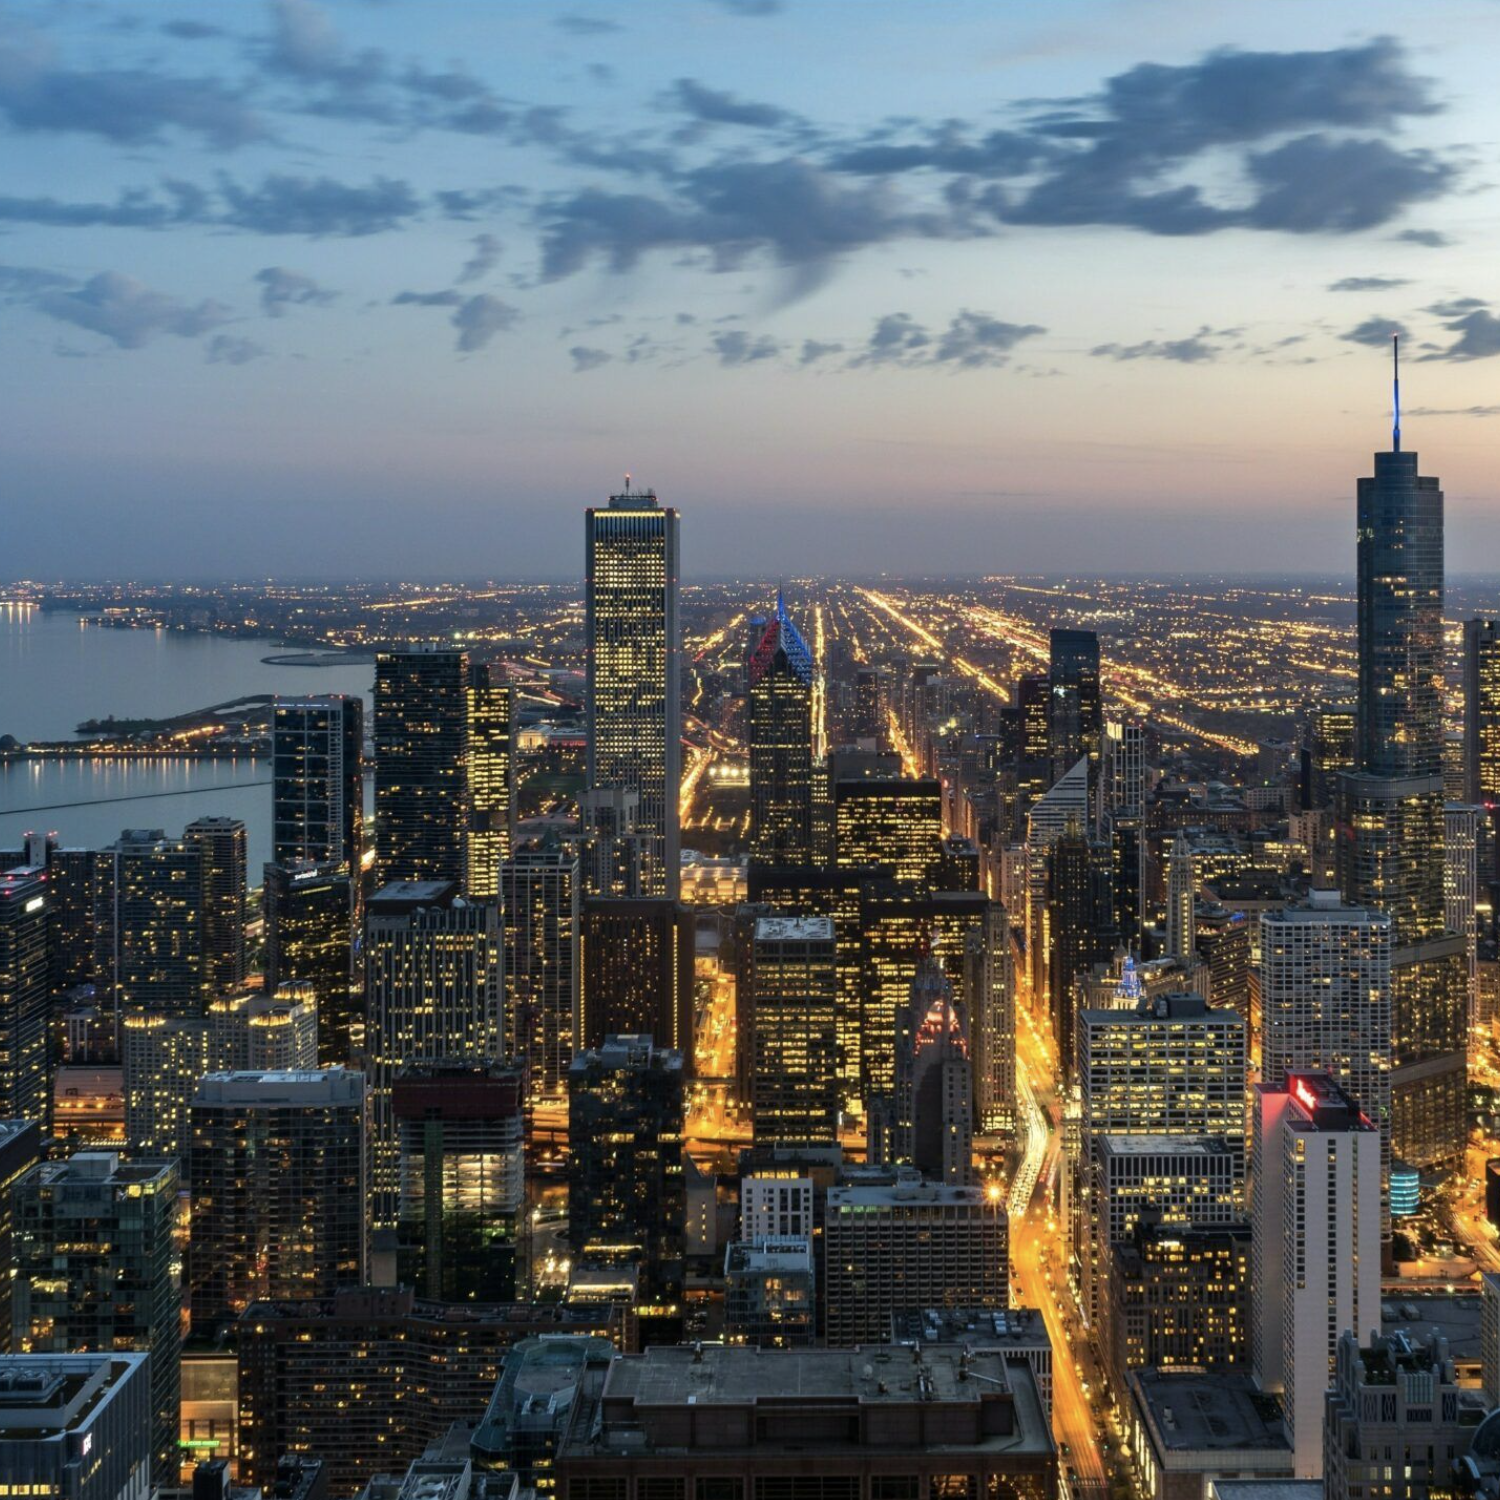
Chicago, one of the greatest city in the U.S, is the most populous city in the Midwestern United States and the fifth most populous city in North America, with a population of 2,746,388 in the 2020 census. However, due to various factors, for decades, this city has been bothered by a non negligible high crime rate, which puts it into the array of most unsafe U.S cities.

Chicago had a murder rate of 18.5 per 100,000 residents in 2012, ranking 16th among US cities with 100,000 people or more, higher than in New York City and Los Angeles. As of 2021, Chicago has become the American city with the highest number of carjackings.
Innocent People are Victims

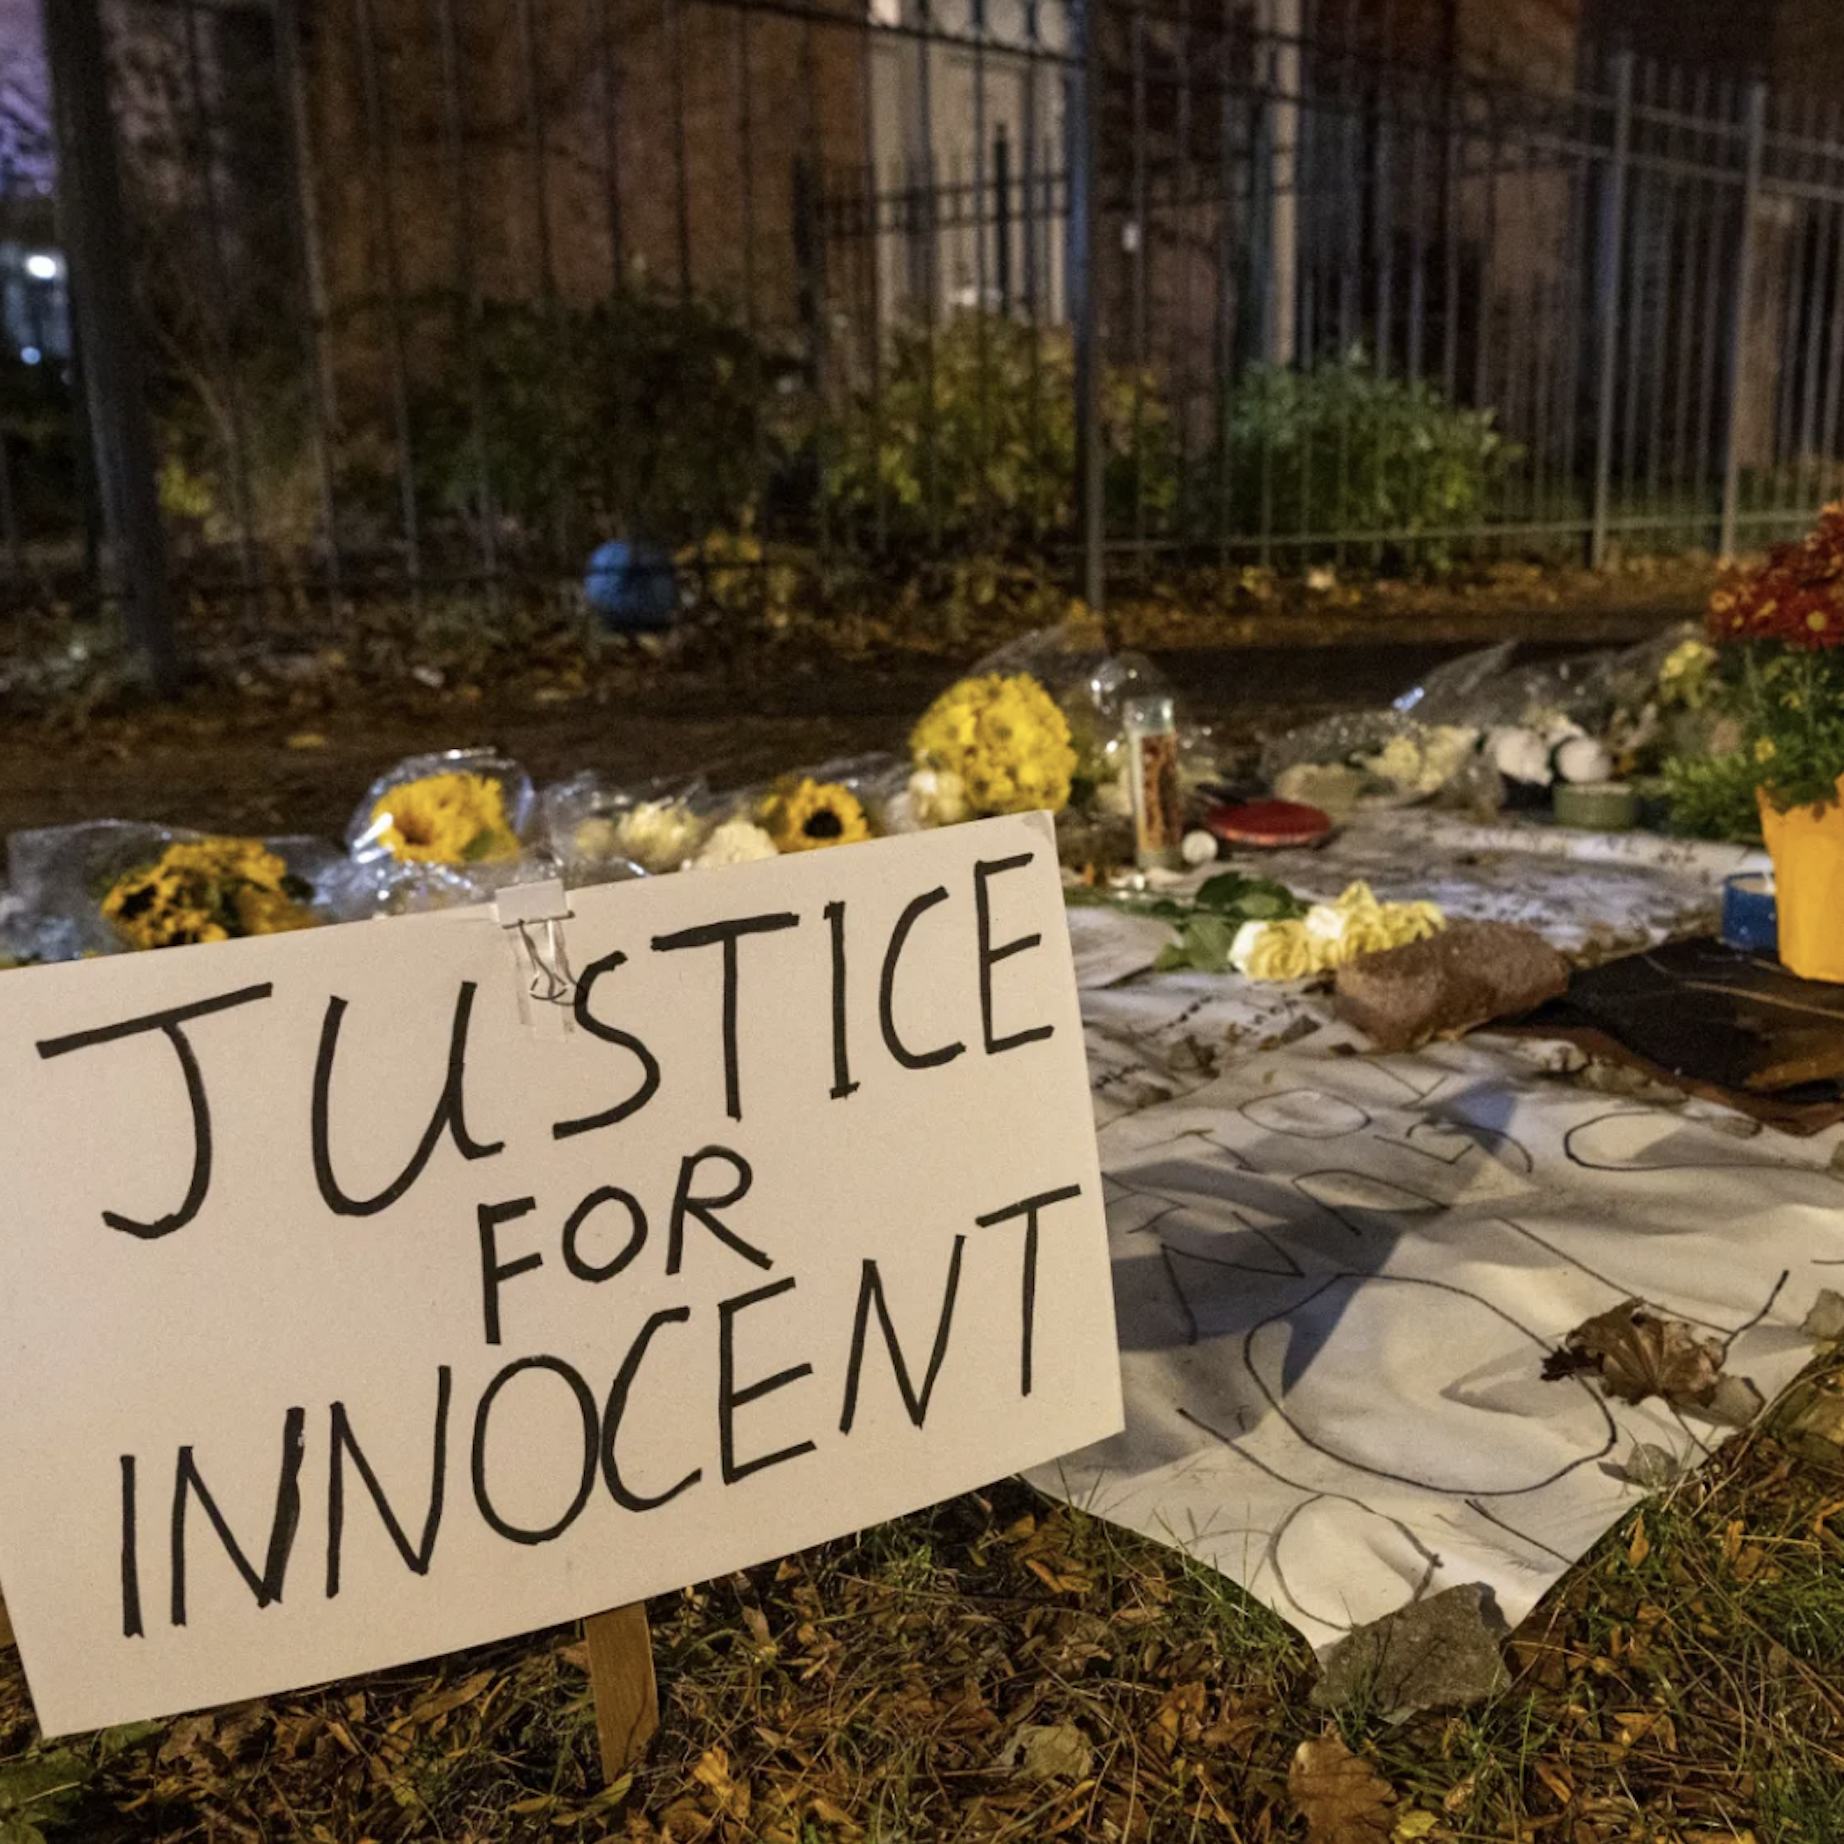
On November 9, 2021, Shaoxiong Zheng, a 24-year-old graduate at the University of Chicago, was robbed and fatally shot by a 19-year-old Chicago resident on the sidewalk near Chicago University. The victim is the second international student from China to be killed in Chicago in 2021. After murdering this young student, the murder kept fleeing across the city and assaulted other 6 people randomly, causing extra 2 deaths and 3 wounded.

The death of Zheng caused great concern across international students, Chicago University. However, he is just one of the thousands of victims suffered from violent crimes in Chicago. There are hundreds of violent crimes happening daily in Chicago.

We Want to Help Using Data Science!

If we could depict crime patterns in Chicago, for example, the dynamic danger level of blocks in different districts, different time, it could help protect Chicago residents from crime. To address this challenge, this project proposes to create data visualizations that allow Chicagoans to visually explore crime data for the past 6 years. The visualizations will dynamically show the geographic distribution of crime over time and allow citizens to explore the hourly distribution of crime using a clock-shaped radar chart. Chicago PD might also benefit from the analysis of crime types and geographic and periodic distribution.

Data Sources

  • 6 Years
  • 31 Types
  • 77 Communities
  • 1,461,450 Records
  • 14 Variables

The data utilized in this project was collected using Chicago Data API. The original data contains 1500378 valid data crime records in Chicago from 01/01/2016 to 02/01/2022. To retain the sample balance of each year, the data of the first two months in 2022 were discarded. The final version of the data contains 14 variables and 1461450 records of crime of 31 types, over the past 6 years, in 77 communities of Chicago. The following visualizations were created using Plotly, Altair and D3.

Dangerous Time

Graph Design Rationale: This Figure serves to check the yearly changes of total crime cases and cases of each crime type. By clicking on each bar, you can drill down to each year and know about the number of crime cases of each type in that year.

So which crime types are increasing and which are decreasing?
Increasing Types: Concealed Carry License Violation; Homicide; Stalking; Weapons Violation
Decreasing Types: Burglary; Gambling; Kidnapping; Narcotics; Prostitution; Public Indecency


Graph Design Rationale: It serves to reveal the number of crime cases of different types during 2016-2021. To make the plot more legible, a log-y axis is applied. Furthermore, a slide bar of years is added to the bottom. Bars are partly arranged in a descending order for a better readability.

Which crime types are the commonest during 2016-2021?
Commonest Types: Theft; Battery; Criminal Damage; Deceptive Practice; Assault


Graph Design Rationale: a linked interactive plot is always favorable to both compare the difference and dive deeper into the details. Hence, a trendy line plot, a bar plot, and a box plot were linked to check the trend and average count and distribution of cases for the top 5 crime types within a year. By clicking on a single line or a bar, the corresponding primary crime type will be highlighted to improve readability. Double clicking on the blank area the plot can reset the plot to the original one.

Theft & Battery are more common.
In line with the plot, conclusions can be made as Theft and Battery are the most common crime types as they have the largest case numbers over time. Furthermore, it is worthy to mention that there are much fewer theft cases during the cold winter season.


Graph Design Rationale: The interactive calendar plot serves to present the daily crime cases during 2016-2021. The daily, monthly, and yearly pattern of crime cases in the past 6 years can be easily figured out with the heatmap.

More Crime Cases in Summer
1. The daily crime cases in summer are much higher than that in winter. This should result from the extremely cold winter in Chicago.

2. Due to the COVID-19 lockdowns, the daily crime cases show an all-year-round trend of decreasing in 2020. However, in 2021, the crime rate slowly went back to its original level.

3. On 05/31/2020, the number of crime cases reached to a peak, which is associated with the notorious violent crime - the most violent day in Chicago in six decades. News Link


Graph Design Rationale: It is universally acknowledged that crimes are more likely to happen during the night. Accordingly, to figure out if this is true, a clock-shaped radar chart was plotted with a dropdown menu, so that you can pick up different types of crime to analyze the detailed shape of the hourly distribution of crime cases.

In What Time, More Crimes Will Happen?
At Night (18:00 pm - 6:00 am): Battery ; Criminal Damage; Robbery; Motor Vehicle Theft; Weapons Violation
At Daytime (6:00 am - 18:00 pm): Theft; Assault; Deceptive Practice; Narcotics; Burglary


Summary - Dangerous Time

Warmer Seasons Come with More Crimes

Except 2020 and 2021, which has balanced number of crime cases across the year, in ordinary years, there are more crime cases between May and October. It is intuitive that warmer weather is beneficial for crimes as there is higher people turnover.

Be Careful in the Afternoon and Evening

According to the statistical work, common crimes such as theft and assult are more likely to happen in the afternoon and the evening. However, there are also some crimes like robbery, which has higher chance to happen during the midnight. When people go out in these time period, they should take more care.

Dangerous Area

Graph Design Rationale: The Crime Count Choropleth Map aims to show an overview of the crime distribution, which uses a color hue to indicate the number of crimes in each community in Chicago. The darker the color, the higher the number of crimes is. The hover labels show the name and number of crimes of the community. Besides, a slider was added to show the changes of the crime over the 6 years.

Which communities are more dangerous and which are safer?
In accordance with the map, Austin and Near North Side have the most crime cases during 2016-2021, while Hegewisch, Burnside, Edison Park and Montclare are the safest.


Graph Design Rationale: The map was created combined with a density plot on a block basis. Zooming in the map, you can get an idea on the frequency of the crime happened in this block, by looking at the color. Purple color represents a high frequency of crimes in the block, while yellow stands for a lower frequency.

Where does the crime tend to happen?
Apparently, crimes are more likely to happen in downtown Chicago. In adition, Southern central area also has a higher risk of crime. In more details, most of the crimes were clustered at the cross and corners of the blocks.


Summary - Dangerous Area

Watch Out when in These Places

Crimes are more likely to happen in the environment which has complex transportation or building layout. Crossroads and corners of blocks are highly risky places where unexpected crimes could take place. People should take care when in these places.

Be Safe in Downtown and South Area

The north area has relatively better public security. Most of cases happened in Chicago downtown and some communities in the south area. People should take special care when they are in these blocks:

  • Several communities around East Garfield Park
  • Blocks near South Shore
  • Auburn Gresham
  • South blocks including Roseland and West Englewood

Crucial Crime Types

Graph Design Rationale: To reveal all the crime types and the proportion of each type, an interactive sunburst plot was made so that you can explore and dive deeper into each primary type by clicking on each part. In agreement with the plot, all the 1.5M records of crime can be classified into over 20 primary types, in which the type of Theft takes the largest proportion. Within the primary types, each case was matched with a detailed description. To interact with the plot, you can click on each primary type to dig deep into it and learn more about the subtypes, and clicking on the central circle can take you back to the previous level.

Top 10 Primary Crime Type
In agreement with the plots, the Top 10 primary crime types are as follows: Theft; Battery; Criminal Damage; Assault; Robbery; Deceptive Practice; Narcotics; Motor Vehicle Theft; Burglary; Weapons Violation


Graph Design Rationale: This interactive treemap serves to show the number of arrested and unarrested cases as well as the portion of different crime types within. Some minority crime types are combined together as 'Other Types' to make them legible. The hierarchical structure is 'Arrest-Crime Type-Domestic', which can help to make comparisons among different crime types. As a functionality of plotly treemap, you can click and open every block for detailed information.

What calls for attention?
1. Most criminals were not arrested, the arrested ratio is roughly 20%.
2. Narcotics are the NO.1 reason for arrest, all of which are non-domestics.
3. Battery are the NO.2 reason for arrest, half of which are related with family issues.


Graph Design Rationale: A different treemap was created to explore the arrest-unarrest ratio of each crime types and the real number of crime cases. The hierarchical structure is 'Crime Type-Arrest-Domestic'. Each crime types is colored uiquely to enhance reading experience.

What calls for attention?
1. Theft and Battery are commonest crime types, but most of the cases are unarrested.
2. It seems tht Narcotics is the only crime type which has a 100% arrest rate.
3. Other violent crime types, such as assault, burglary and robbery, have a rather low arrest portion.
4. Battery has close numbers of domestic and non-domestic cases, either of which is halfly arrested.


Summary - We Need Strict Policies

Unpunished Criminals

Theft, assault, crinimal damage and deceptive practice are very common crime type in Chicago. However, only a small proportion of the crinimals involved are arrested. The rest of them just flee from the law punishment and keep doing harm to our society. Some even more violent crimes such as robbery, has even lower arrest rate.

Insist Zero Tolerence to Drug-related Crimes

It is inspiring that Chicago Security System is always tough to narcotics crimes. All the recorded cases result in arrest with no exception. Drug crimes are one of the most harmful crime type to citizen health and society stability, and should always be punished heavily.

Conclusions

  • Descending Trend

    In 2016-2019, the yearly number of crime cases in Chicago kept decreasing. In 2020, due to the COVID-19 lockdowns, the number of crime cases in Chicago dropped drastically.

  • Ubiquitous Theft and Battery

    Among the recorded crime types, theft and battery have the most cases every year. These 2 types of crime take around 40 percentage of all cases in Chicago.

  • Inadequate Arrest Actions

    Although numerous cases happen daily in Chicago, there are less than 20 percent of the cases got the criminal arrested.


Guidance for Personal Safety

Be with Support

  • Aviod hanging out alone in unfamiliar places. Stay with crowd, stay with friends.
  • Know the nearest places to find help such as police station or school security bureau. When in emergency, do not hesistate to call 911.
  • Even faced with domestic crimes, you can resort to 911 for help. They are even tougher for domestic crimes.

Watch Out for Dangerous Places and Time

  • Aviod going out in late time. Although many crimes happen during daytime, it is very hard to get support during night time.
  • Stay away from blocks in poor security condition. Stay away from places where tramp and drug addicts gathered. In Chicago, downtown and south area has more crime records than the north area.